One of the challenges faced by organizations is protecting their end-users from various types of threats. Host-based tools used for cyber defense include various forms of signature/pattern matching, malicious behavior detecting tools and enforcing policies such as rules for passwords as well as ensuring certain things are or not performed on host systems. Basically, many organizations strive to meet guidelines such as CIS Top 20 Security Controls.
Even with these efforts properly executed, malware and other threats can still end up on host systems. Users may be tricked into wilily installing the wrong stuff, click a link redirecting them to an exploit kit designed to automate the exploitation process or the threat may be encoded, packed or function in a way that doesn’t trigger the host-based security tools. Best practice is to include People, Process and Technology into your host defense strategy. The problem is the “people” and “process” is very reactive IE only responding with the tools say something is wrong.
The solution is gaining visibility into endpoints based on behavior and anomaly-based monitoring. Behavior is not just based on known threats such as what antivirus does. Behavior identifies malicious activity. Anomaly means baselining normal behavior and triggering when a large deviation is seen. The combination of behavior and anomaly is very powerful since anything that tries to “hide” will stand out as an anomaly.
One very popular method to gain this visibly is with NetFlow. I’ve covered solutions such as Plixer and Cisco Stealthwatch that provide network based NetFlow security monitoring.
One cool new capability within Cisco AnyConnect is the ability to collect NetFlow from the host level. This means visibility into any process and identifies anomalies as well as potential malicious activity. One could say its like “Stealthwatch” for the endpoint. The NVM module within Splunk allows an administrator to quickly digest host NetFlow and operationalize it.
Let’s check out how this looks.
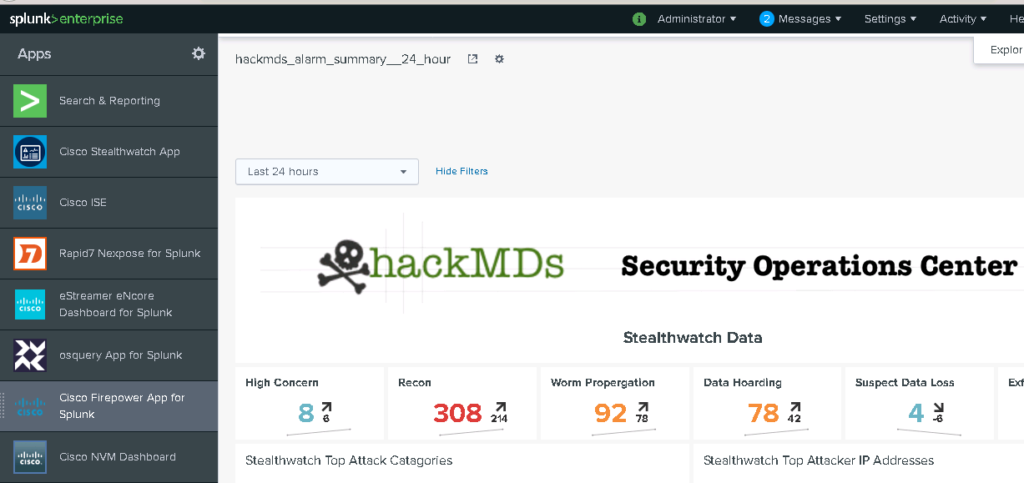
First thing to understand is that this is an App within Splunk. Notice on the bottom left.
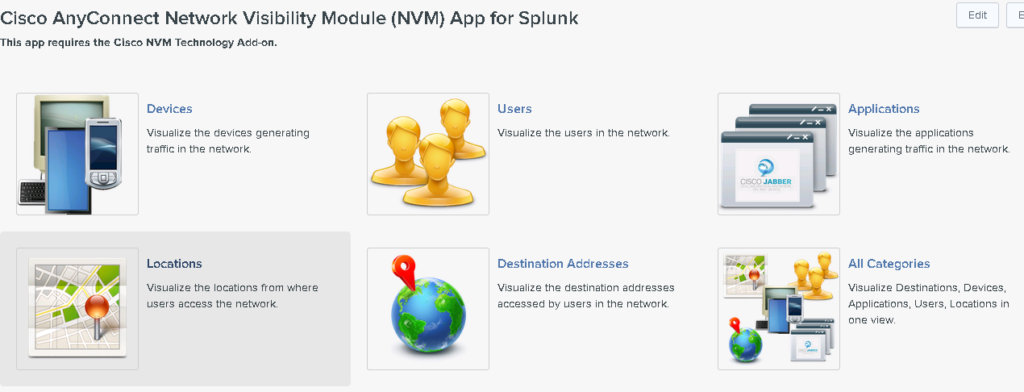
When I click the App, I have options to view details on devices, users, what applications are being used, and located hosts.
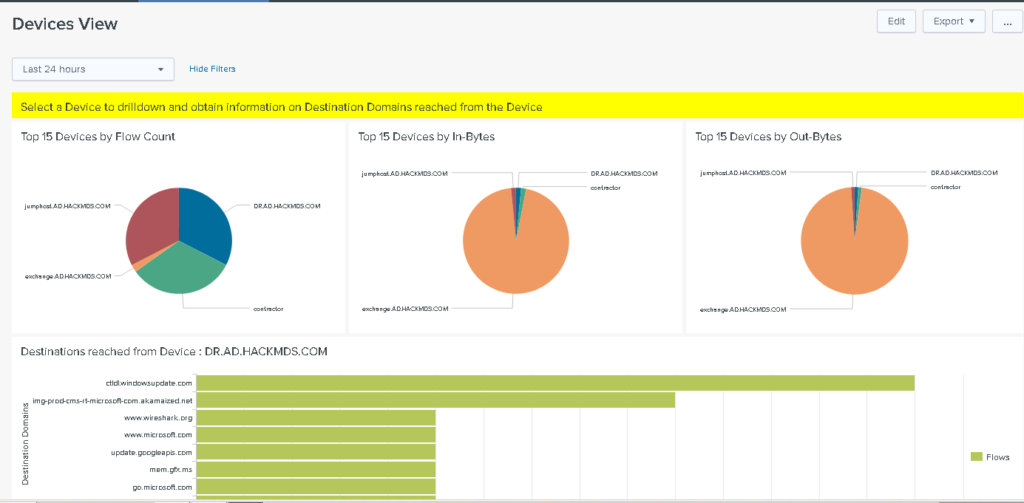
Let’s say I want to look at this Dr’s computer, I can quickly click into it and see what sources he/she has reached out to.

If I need to see what applications are running, I can quickly see that too.
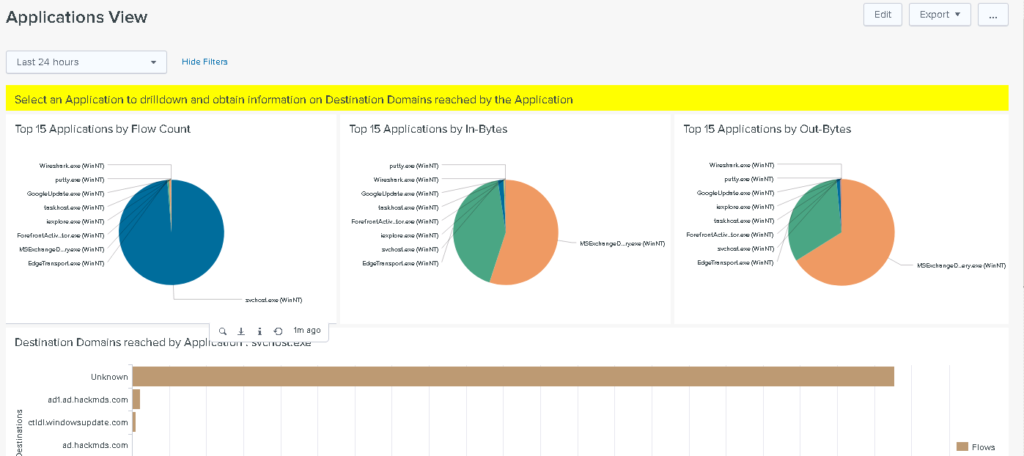
Or maybe you want to see down to the process level including where they are communicating too.
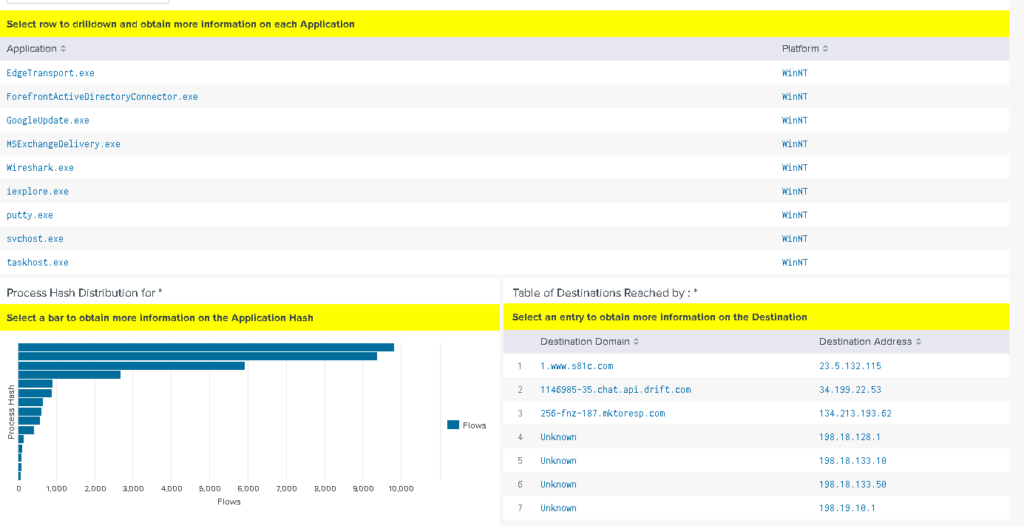
There are a ton of dashboards and methods to drill into host level data. These are some of the out-of-the-box dashboards that are available.
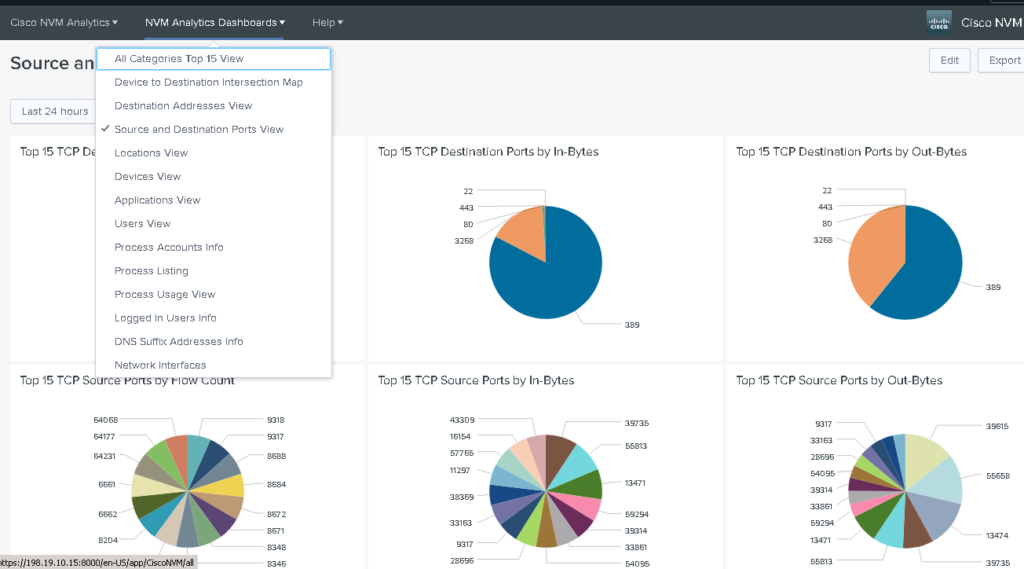
If you are a Splunk and/or AnyConnect users, you should really check this out. Learn more at https://splunkbase.splunk.com/app/2992/